Renewables
2018 BP Energy Outlook
© BP p.l.c. 2018
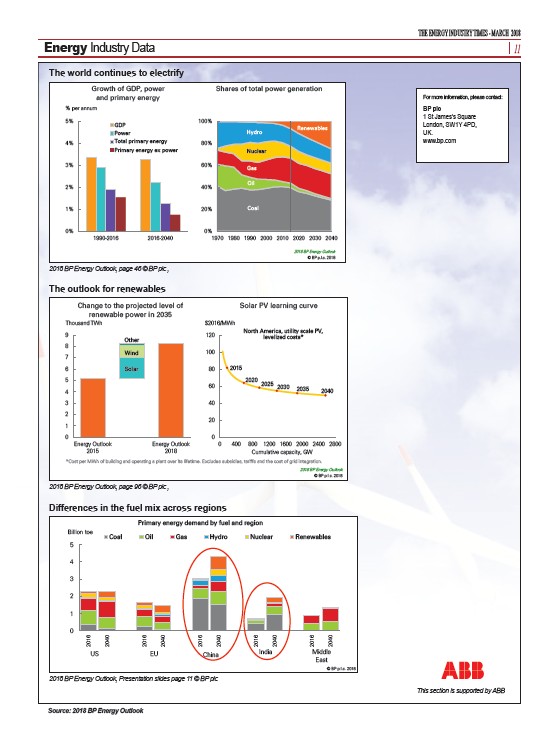
The world continues to electrify…
Growth of GDP, power
and primary energy
% per annum
Shares of total power generation
100%
80%
60%
40%
20%
0%
Hydro
Nuclear
Gas
Oil
Coal
1970 1980 1990 2000 2010 2020 2030 2040
Sectors: Power
46
5%
4%
3%
2%
1%
0%
GDP
Power
Total primary energy
Primary energy ex power
1990-2016 2016-2040
Fuels: Renewables
The outlook for renewables has increased significantly...
Solar PV learning curve
The outlook for renewables
Change to the projected level of
renewable power in 2035
Other
Wind
$2016/MWh
120
100
80
60
40
20
North America, utility scale PV,
levelized costs*
Differences in the fuel mix across regions
Coal Oil Gas Hydro Nuclear Renewables
© BP p.l.c. 2018
9
8
7
6
5
4
3
2
1
Differences in the fuel mix across regions
11
Billion toe
5
4
3
2
1
0
2016
2040
2016
2040
2016
2040
2016
2040
2016
2040
US EU China India Middle
East
Primary energy demand by fuel and region
2018 BP Energy Outlook
© BP p.l.c. 2018
0
Energy Outlook
2015
Energy Outlook
2018
Thousand TWh
Solar
0
0 400 800 1200 1600 2000 2400 2800
Cumulative capacity, GW
2015
2020
2025
2035 2040 2030
*Cost per MWh of building and operating a plant over its lifetime. Excludes subsidies, tariffs and the cost of grid integration.
96
The world continues to electrify
2018 BP Energy Outlook, page 46 © BP plc ,
2018 BP Energy Outlook, page 96 © BP plc ,
2018 BP Energy Outlook, Presentation slides page 11 © BP plc
This section is supported by ABB
Source: 2018 BP Energy Outlook
THE ENERGY INDUSTRY TIMES - MARCH 2018
Energy Industry Data 11
For more information, please contact:
BP plc
1 St James’s Square
London, SW1Y 4PD,
UK.
www.bp.com
/www.bp.com