8,133 8,207
11,531
14,703
20,310
26,850
38,475 39,062 40,635
45,030
36,023
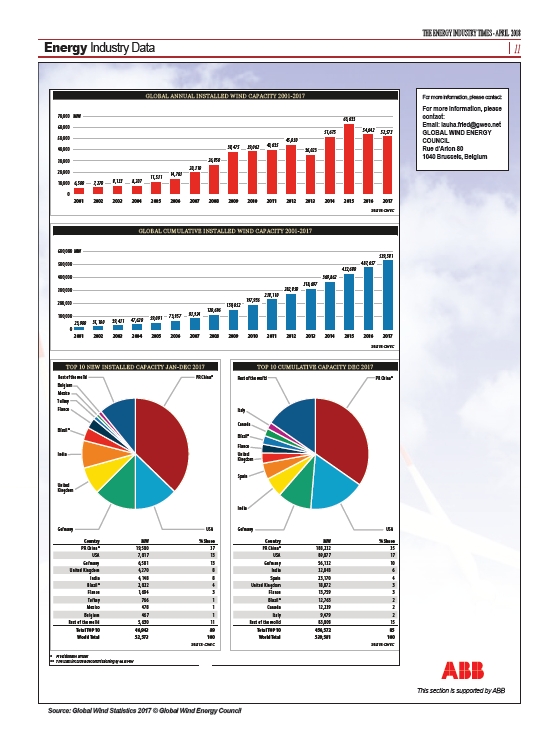
GLOBAL CUMULATIVE INSTALLED WIND CAPACITY 2001-2017
54,642 52,573
487,657
63,633
432,680
51,675
369,862
318,697
238,110
197,956
282,850
TOP 10 CUMULATIVE CAPACITY DEC 2017
159,052
Rest of the world
Italy
Canada
Brazil*
France
United
Kingdom
Spain
India
539,581
PR China*
Germany USA
Country MW % Share
PR China* 188,232 35
USA 89,077 17
Germany 56,132 10
India 32,848 6
Spain 23,170 4
United Kingdom 18,872 3
France 13,759 3
Brazil* 12,763 2
Canada 12,239 2
Italy 9,479 2
Rest of the world 83,008 15
Total TOP 10 456,572 85
World Total 539,581 100
Source: GWEC
70,000
60,000
50,000
40,000
30,000
20,000
10,000
600,000
500,000
400,000
300,000
200,000
100,000
MW
6,500 7,270
MW
59,091 73,957 23,900 31,100 39,431 47,620
93,924
TOP 10 NEW INSTALLED CAPACITY JAN-DEC 2017
Rest of the world
Belgium
Mexico
Turkey
France
Brazil*
India
United
Kingdom
120,696
PR China*
Germany USA
Country MW % Share
PR China* 19,500 37
USA 7,017 13
Germany 6,581 13
United Kingdom 4,270 8
India 4,148 8
Brazil* 2,022 4
France 1,694 3
Turkey 766 1
Mexico 478 1
Belgium 467 1
Rest of the world 5,630 11
Total TOP 10 46,943 89
World Total 52,573 100
Source: GWEC
0
2001 2002 2003 2004 2005 2006 2007 2008 2009 2010 2011 2012 2013 2014 2015 2016 2017
Source: GWEC
GLOBAL ANNUAL INSTALLED WIND CAPACITY 2001-2017
0
2001 2002 2003 2004 2005 2006 2007 2008 2009 2010 2011 2012 2013 2014 2015 2016 2017
Source: GWEC
* Provisional Number
** The stats include a decommissioning of 648 MW
This section is supported by ABB
Source: Global Wind Statistics 2017 © Global Wind Energy Council
THE ENERGY INDUSTRY TIMES - APRIL 2018
Energy Industry Data 11
For more information, please contact:
For more information, please
contact:
Email: lauha.fried@gwec.net
GLOBAL WIND ENERGY
COUNCIL
Rue d’Arlon 80
1040 Brussels, Belgium
link
link